page-header-img

Data Analytics

What is the Course About?

The “Data Analytics: Tools and Techniques” course is designed to equip learners with practical skills required to succeed in today’s data-driven industry.  dataanalytics course in vizag .

Whether you are an aspiring data analyst or a working professional looking to upskill, this program provides structured, hands-on training in core data tools and technologies. Data analytics course in vizag

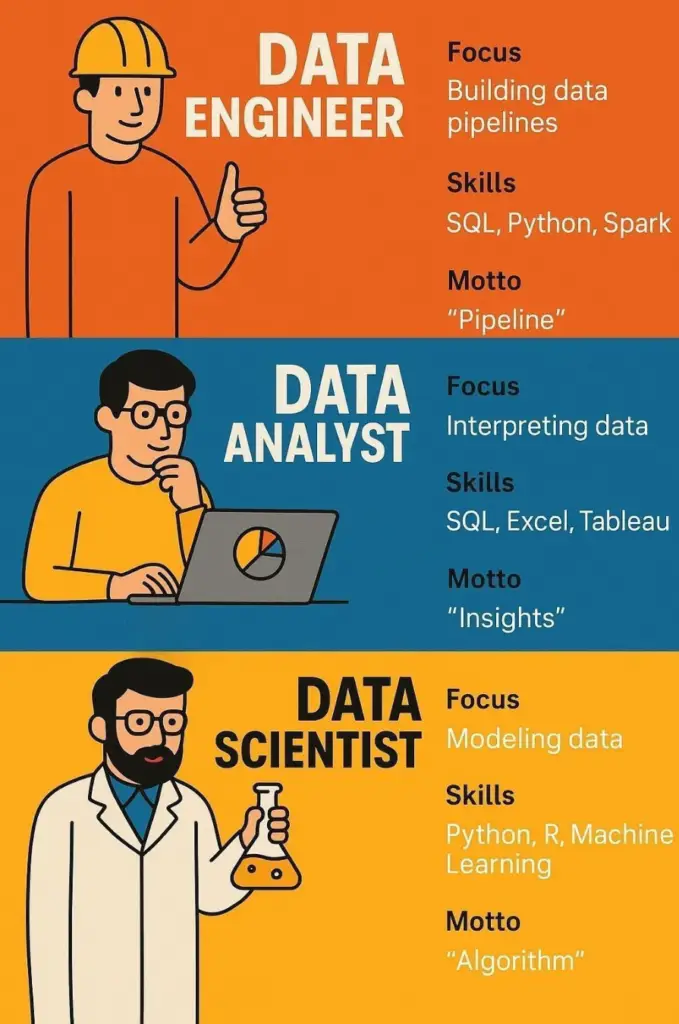
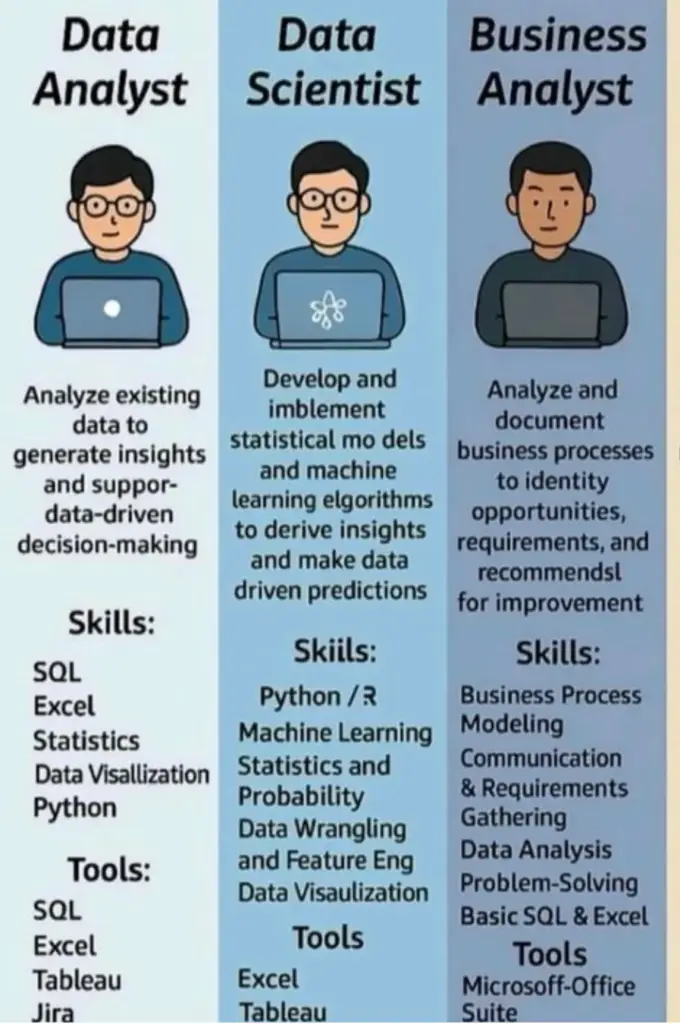
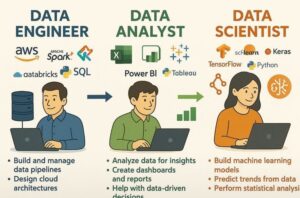
The course covers Advanced Excel, Python Programming, Database Management (SQL & intro to NoSQL), Power BI, and an optional introduction to Machine Learning. dataanalytics course in vizag

You will learn how to collect, clean, analyze, visualize, and interpret data to generate meaningful business insights. dataanalytics course in vizag

What Will You Learn?

  1. Python Programming: Build a strong foundation in Python, including syntax, data structures, control flow, and data analysis using NumPy, Pandas, and Matplotlib. dataanalytics course in vizag
  2. Advanced Excel: Master data cleaning, pivot tables, advanced formulas, lookup functions, data validation, Power Query, Macros, and AI-enabled Excel features.
  3. Database Management: Understand database fundamentals, data modeling, normalization, SQL queries, joins, subqueries, and advanced T-SQL concepts including stored procedures, triggers, and transactions. Gain exposure to MySQL, PostgreSQL, MongoDB, Redis, Cassandra, and Neo4J.
  4. Power BI: Learn data import, transformation, data modeling, DAX basics, dashboard development, performance optimization, and report publishing for business insights. dataanalytics course in vizag
  5. Machine Learning (Optional Module): Introduction to Machine Learning fundamentals, ML workflow, scikit-learn basics, model training, prediction, and evaluation(basics). dataanalytics course in vizag
  1. Data Analysis using Excel, SQL, and Python
  2. Data Visualization and Dashboard Development using Power BI
  3. Database Querying and Data Modeling
  4. Python-based Data Processing and Analysis
  5. Automation and Reporting Techniques
  6. End-to-End Data Analytics Workflow. dataanalytics course in vizag

Why Should I Enroll in This Course?

This course is designed for individuals seeking a strong foundation and practical exposure in data analytics.

With structured learning, hands-on exercises, real-world datasets, and live project experience, you will gain industry-relevant skills that prepare you for real business environments. dataanalytics course in vizag.

dataanalytics course in vizag

Advanced Excel


Overview of Data Analytics

Introduction to Microsoft Excel
 
Absolute and Relative References
 
Keyboard Shortcuts
 
Manipulating Rows and Columns
 
Formatting Output
 
Move or Copy Cell or Cell Content
 
Number Formats in Excel
 
Formulas in Excel
 
Create and Format Tables
 
Create Chart from Start to Finish
 
Create a Pivot Table to Analyze
 
Share Workbook with Others
 
Date and Time Functions
 
Advanced Paste Special Function
 
Sorting and Filtering
 
IF Analysis
 
Logical Functions
 
Data Validation
 
Array Functions
 
Lookup Functions (VLOOKUP/HLOOKUP, INDEX and MATCH, Nested VLOOKUP, Reverse Lookup, Worksheet Linking Using INDIRECT, VLOOKUP with Helper Columns)
 
Macros in Excel
 
Power Query in Excel
 
AI in Excel
 
Handling Excel using Python library
Python Programming


History & Background
 
Basic Syntax, Variable Types
 
Data structures (lists, tuples, dictionaries, sets)
 
Operators and expressions
 
Control flow (if–else, loops)
 
Functions and basic program structure
 
Data Analysis with Python
 
NumPy for numerical computing
 
Pandas for data manipulation and analysis
 
Matplotlib for data visualization
 
Basic data exploration and visualization techniques
Database
Module 1: Introduction to Databases
 
Database Management Systems (DBMS)
 
Fundamental Database Concepts
 
Database Types
 
Joins and SQL Queries
 
Data Modeling
 
Normalization in Database Design
 
SQL Server and Tools
 
Module 2:Transact-SQL (T-SQL) for Data Analyst(Azure SQL)
 
Introduction to Transact-SQL (T-SQL)
 
Relational databases and T-SQL basics
 
SQL statement structure and SELECT statement
 
Data types and handling NULL values
 
Sorting and Filtering Data
 
Sorting results
 
Filtering data with WHERE clauses
 
Removing duplicates
 
Combining Data with Joins
 
Inner joins, outer joins, cross joins, and self joins
 
Subqueries in T-SQL
 
Scalar, multi-valued, and correlated subqueries
 
Built-in Functions and GROUP BY
 
Scalar and aggregate functions
 
Summarizing data with GROUP BY and HAVING
 
Data Modification with T-SQL
 
Inserting, updating, and deleting data
 
Merging data across tables
 
Advanced T-SQL Programming
 
Stored procedures and user-defined functions
 
Tables, Views, and Temporary Objects
 
Creating tables, views, temporary tables, and CTEs
 
Error Handling
 
TRY…CATCH for error handling
 
Transactions
 
Transactions with BEGIN, COMMIT, and ROLLBACK
 
Triggers
 
Triggers in SQL Server (Azure SQL Database)
 
Create, Alter, Drop Triggers
 
Overview of Databases
 
MySQL, PostgreSQL
 
Redis
 
Cassandra
 
Neo4J
 
MongoDB
Fundamentals of Power BI
Module 1: Introduction to Power BI
 
Overview of Data Analysis – Basics and importance.
 
Roles in Data – Understanding the role of a Data Analyst.
 
Introduction to Business Intelligence.
 
Key Tasks of a Data Analyst.
 
Power BI Desktop – Interface walkthrough and setup.
 
Building Blocks of Power BI – Dashboards, reports, and visualizations.
 
Module 2: Importing and Preparing Data
 
Importing Data – Connecting to sources like Excel, CSV, and SQL databases.
 
Data Loading Modes – Differences between Import and DirectQuery.
 
Data Transformation Basics – Cleaning, renaming, splitting columns, and filtering rows.
 
Combining Data – Merging and appending queries for a unified dataset.
 
Module 3: Data Modeling Fundamentals
 
Creating Relationships – Managing relationships between tables in Power BI.
 
Introduction to DAX – Basics of Data Analysis Expressions (SUM, COUNT, AVERAGE).
 
Calculated Columns and Measures – Writing formulas for specific calculations.
 
Date Tables – Creating and configuring a date table for time-based analysis.
 
Module 4: Building Visualizations
 
Visualizations – Bar, pie, line, and stacked charts.
 
Tables and Matrices – Presenting data in tabular form.
 
Filters and Slicers – Adding interactivity to reports.
 
Formatting Visuals – Customizing colors, themes, labels, and layouts.
 
Module 5: Report Design and Interactivity
 
Report Layouts – Designing structured and user-friendly layouts.
 
Drill-Through and Page Navigation – Setting up interactive elements.
 
KPIs and Cards – Highlighting key performance metrics.
 
Bookmarks and Buttons – Enhancing navigation and user experience.
 
Module 6: Advanced Analytics and Insights
 
DAX Time Intelligence – Year-to-date (YTD) and month-to-date (MTD) calculations.
 
Conditional Formatting – Highlighting trends and top-performing values.
 
Smart Narratives and Key Influencers – Deriving insights and explaining data trends.
 
Manual Data Refresh – Refreshing and updating data in Power BI Desktop.
 
Module 7: Performance Optimization and Troubleshooting
 
Optimizing Data Models – Reducing model size and improving performance.
 
Data Type Management – Choosing the correct data types for efficiency.
 
Identifying and Fixing Issues – Troubleshooting errors in Power BI.
 
Report Performance Tips – Best practices for creating efficient reports.
 
Module 8: Dashboards and Report Publishing
 
Creating Dashboards – Pinning visuals for quick insights.
 
Exporting Reports – Exporting reports to PDF and PowerPoint formats.
 
Sharing Options – Collaborating by sharing PBIX files or publishing to Power BI Service.
Introduction to Machine Learning(OPTIONAL)
Machine Learning Fundamentals
 
What is Machine Learning?
 
Relationship between Machine Learning and Data Analytics
 
Types of Machine Learning
 
Working with Data and ML Workflow
 
Scikit learn and Built-in datasets
 
Features and target variables
 
Data understanding and exploration
 
Train-test split
 
Model Building and Evaluation
 
Model training and prediction
 
Hands on
 
Model evaluation using accuracy
 
Comparing model performance
Review and Project Work
Internship - 2 Live projects
JNNC Technologies

📌 Courses designed to match current industry needs
📌 Updated curriculum based on real workplace requirements

👩‍🏫 Experienced professionals with real working knowledge
👨‍🏫 Practical techniques + live project guidance

🎓 Real practice on live projects
🔧 Helps build a strong portfolio

✅ Affordable Fees & Easy Payments

💲 Flexible fee options
📅 Installment plans available

✅ Certification

📜 Recognized completion certificate
Great for LinkedIn, resumes, job applications

✅ Small Batch Classes

🎯 Personalized attention
🗣 Interactive doubt clearing
💡 Better learning outcomes

✅ Flexible Timing

⏱ Weekday & weekend batches available
🌐 Online and offline modes

🚀 Why Students Love JNNC Technologies

✔ Learn real skills, not just theory
✔ Get placed faster
✔ Full support till career success

Why choose JNNC Technologies?

⭐ Expert Trainers
⭐ Live Projects
⭐ Job & Resume Support
⭐ Flexible Batches
⭐ Certification

Leave a Reply

Your email address will not be published. Required fields are marked *

error: Content is protected !!
Call Us